
 NOAA Technical Memorandum ERL CMDL-9
OAXTC 92: OCEAN / ATMOSPHERE EXCHANGE OF TRACE COMPOUNDS 1992
Cooperative Institute for Research in Environmental Sciences University of Colorado Boulder, Colorado
James H. Butler
Stephen A. Montzka
Richard C. Myers
James W. Elkins
Climate Monitoring and Diagnostics Laboratory Boulder, Colorado July 1995
UNITED STATES DEPARTMENT OF COMMERCE
Ronald H. Brown
Secretary
D. James Baker
Under Secretary for Oceans and Atmosphere/Administrator
Environmental Research Laboratories
James L. Rasmussen
Director
Notice
Mention of a commercial company or product does not constitute
an endorsement by NOAA Environmental Research Laboratories. Use
for publicity or advertising purposes of information from this
publication concerning proprietary products or the tests of such
products is not authorized.
This government document is provided for downloading and for the sole purpose of personal viewing and printing. The content of this document is not classified in any way. However, we expect every user to exclusively use this document in its entirety and we do not authorize any alteration, partial distribution or the
use of parts of it in other publications, neither do we permit the commercial use of any of its content. For questions regarding the use of this document, contact the authors.
This document is for sale by the National Technical Information Service, 5285 Port Royal Road Springfield, VA 22061
	ABSTRACT 								1
1. 	INTRODUCTION AND OBJECTIVES						1
2. 	CRUISE TRACK								2
3. 	EXPERIMENTAL AND DATA ANALYSIS						3
3.1. 	The Ship 								3
3.2. 	Sampling 								3
3.2.1. 	Continuous Air and Surface Water Measurements 				3
3.2.2. 	Collection and Analysis of Flask Samples 				5
3.3. 	The OAXTC Air / Surface Water System 					5
3.4. 	Air / Surface Water and Deepwater Measurements of HCFC-22 		9
3.5. 	Ancillary Data	 							9
3.6. 	Data Reduction 								10
3.7. 	Calibration 								10
3.8. 	Calculations 								11
3.8.1. 	Mixing Ratios 								11
3.8.2. 	Correction for Warming of Equilibrator Data 				12
3.8.3. 	Saturation Anomalies and Fluxes 					13
4. 	RESULTS 								15
4.1. 	Ancillary Data 								15
4.2. 	doesn't exist, but for the sake of consistency with the printed version, we leave it like this.  =:->
4.3. 	CFC-11 and CFC-12 							15
4.3.1. 	Time Series of CFC-11 							15
4.3.2. 	Latitudinal Profiles of CFC-11 and CFC-12 				18
4.4. 	HCFC-22 								21
4.4.1. 	Air / Surface Water Measurements 					21
4.4.2. 	Deepwater Measurements 							21
4.5. 	Methyl Chloroform 							25
4.6. 	Carbon Tetrachloride 							25
4.7. 	CFC-113 								30
4.8. 	Nitrous Oxide 								30
5. 	DISCUSSION 								33
	HCFC-22 								33
	Methyl Chloroform 							34
	Carbon Tetrachloride 							35
6. 	REFERENCES 								38
7. 	APPENDICES 								40
7.1. 	Data 									40
7.2. 	List of Abbreviations, Acronyms, Units, and Compounds 			42
7.2.1. 	Units 									42
7.2.2. 	Acronyms and Abbreviations 						42
7.2.3. 	Compounds 								43
	ACKNOWLEDGMENTS 							43
Oceanic Measurements of HCFC-22, CFC-11, CFC-12, CFC-113, CH3CCl3, CCl4, and N2O in the Marine air and Surface Waters of the West Pacific Ocean (03. August to 21. October 1992)
Jürgen M. Lobert, James H. Butler, Thomas J. Baring, Stephen M. Montzka, Richard C. Myers, and James W. Elkins
CFC-11 (CCl3F), CFC-12 (CCl2F2), CFC-113 (CCl2FCClF2), methyl chloroform (CH3CCl3), carbon tetrachloride (CCl4), nitrous oxide (N2O) and HCFC-22 (CHClF2) were measured in the air and surface waters of the Pacific Ocean between 55°N and 22°S during the late summer and early fall of 1992. Atmospheric measurements of all gases agreed well with results from NOAA fixed stations at similar latitudes. CFC-11, CFC-12, and CFC-113, which have long atmospheric lifetimes and are essentially inert in seawater, responded mainly to physical processes in the air and water. The first two gases were supersaturated by 2-6% at higher, northern latitudes, reflecting the effects of radiative warming. Their saturation anomalies declined southward through the tropics and ultimately became slightly negative in the southern hemisphere. HCFC-22 showed signs of small losses in the tropics and subtropics, a sink that may account for 2% of the losses of this gas from the atmosphere. CH3CCl3 showed a similar pattern, with only a tropical sink, which is consistent with hydrolysis and, together with data from an earlier expedition, implies that about 6% of atmospheric CH3CCl3 is lost to the ocean. The net saturation anomaly for CCl4 was virtually negative everywhere and only slightly dependent upon latitude. This would be expected for a sink that was not particularly temperature dependent and it is consistent with evidence from deepwater profiles that indicate a sink at depth. Fluxes calculated from CCl4 saturation anomalies indicate that 15-35% of atmospheric CCl4 is lost to the ocean. N2O surface water data indicated weak equatorial upwelling. Saturation anomalies ranged from 1-6%, which would be consistent with a small source in the W. Pacific.
The Ocean/Atmosphere Exchange of Trace Compounds (OAXTC) study was conducted as a special project by the Climate Monitoring and Diagnostics Laboratory (CMDL) of the National Oceanic and Atmospheric Administration (NOAA) during the fall of 1992. This study was coupled with the World Ocean Circulation Experiment (WOCE) investigation of Line P-13. The cruise was performed aboard the University of Southern California research vessel John V. Vickers. The scientific crew included participants from several institutions including NOAA's Pacific Marine Environmental Laboratory (PMEL), who measured depth profiles of CFC-11, CFC-12, methyl chloroform and carbon tetrachloride as part of the WOCE program, allowing for comparison of data sets and profiles.
The main goal of this study was to determine the atmospheric mixing ratio of hydrochlorofluorocarbon (HCFC-22) and its partial pressure in surface waters of the West Pacific Ocean to assess the possible existence of an oceanic sink for this compound. HCFC-22 is one of the temporary replacement halocarbons in use to promote the phase-out of fully halogenated chlorofluorocarbons, initiated by the Montreal Protocol [UNEP 1987]. The growth rate of CFC-11 has been reported to be close to zero and half of the rate of 1988 for CFC-12 [Elkins et al., 1993] making HCFC-22 one of the major halocarbons in use today with a growth rate of 7.3% per year and a global mean of around 101.8 ppt [Montzka et al., 1993]. Water column measurements of HCFC-22 were also planned to complement air and surface water determinations to better illustrate its behavior in the ocean.
CFC-12, CFC-11, CFC-113, CH3CCl3, CCl4 and N2O were added to these measurements for comparison to similar data that were obtained during previous cruises [Butler et al., 1991]. Specific attention was paid to determine the importance of oceanic sinks for methyl chloroform [Butler et al., 1991] and carbon tetrachloride [Wallace et al., 1993; Butler et al., 1993].
The cruise began in Long Beach, California on August 4, 1992,
leading in a wide bow through the Gulf of Alaska to the first
stop in Dutch Harbor, Alaska, on August 14, 1992, for exchange
of personnel and ship repairs (Figure 1). Leg 1 then continued
through the southern Bering Sea to a point offshore of Kamchatka,
Russia, the official WOCE P-13 line-start, on August 21, 1992.
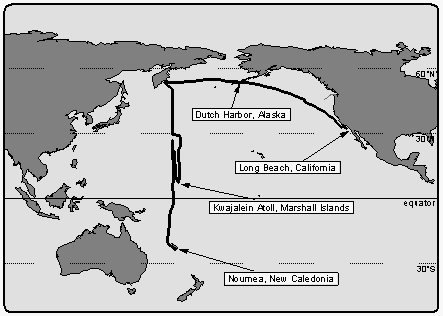
The intended cruise track lead from 54° North to 22° South along meridian 165° East. The ship stopped every 0.5 to 0.7 degrees of latitude for deployment of CTD (conductivity, temperature, and depth) deepwater casts. Typical times on station were between 4 and 5 hours, steaming between stations took about 2 hours. Because of heavy storms and structural deformations encountered on the ship, leg 1 was interrupted at 30.7°N and the ship steamed without stop to Kwajalein Atoll, Marshall Islands, located at 8.7°N and 167.7°E, which was the designated port stop for exchange of personnel, initially planned for a later point during the cruise. On September 15, 1992, the ship arrived in Kwajalein and left after 11 days. The structural deformations had been evaluated to be not critical for the continuation of the cruise.
On leg 2, the ship steamed north to continue the line along 165°E and CTD hydrocasts were resumed at 28°N. However, because of the delays during leg 1, CTD stations were spaced by two degrees except near the equator, where spacing was 0.5 degrees. The last CTD cast was deployed at 4.7°S / 165°E and the ship finished its cruise by steaming south and arrived Noumea, New Caledonia on October 21 without further interruption. A total distance of about 19000 km was covered during this 12-week expedition.
The research vessel John V. Vickers is a converted tuna
fish cutter, 67.1 m long with a 11.6 m beam, has four decks of
which numbers two to four were used for scientific operations
(Figure 2). The CMDL crew was located on C-deck in the ship's
main laboratory. A total of 40 persons was accommodated, including
14 crew members. CTD casts were deployed from the "T"
frame seen at midship on the starboard side, the intake line for
our ambient air measurements was located on top of the front mast,
the equilibrator was mounted behind the main lab.
For the determination of surface water saturations of all compounds, we used an acrylic seawater equilibrator, originally designed by Ray Weiss of Scripps Institute of Oceanography, as done on previous cruises [Butler et al., 1988b, 1991]. The equilibrator was mounted on one of the vans on the rear deck, just behind the main lab. Vent lines for the inner chambers were eventually drawn to the front mast to ensure a clean environment for all equilibrator openings. The main exit and inlet of the equilibrator were connected in a closed loop that circulated the current headspace air at a flow rate of 6-8 l min-1, out of which a small aliquant of about 360 cm3 was withdrawn over a 6 minute period to flush the sample loops of the gas chromatographs. The 21-liter headspace with a 20 l min-1 flow rate of water ensured that the equilibrium inside the equilibrator was not measurably disturbed [Butler et al., 1988b].
Ambient air and equilibrator headspace air were sampled using a two channel pump board, one channel each for air and equilibrator gas streams (Figure 3). Each channel consisted of 3/8" OD Dekoron tubing leading into Cole-Parmer Model 7530-40 diaphragm pump, a water trap made of a 0.5 l Whitey stainless steel flask, filled with 1 mm glass beads to remove bulk water vapor from the sampled air and a Conflow model GH3OXT-HMXXX mechanical back pressure regulator, set to 560 hPa. This maintained a flow through the Dekoron tubing of about 8 l min-1, and allowed a flow of about 60 cm3 min-1 through the attached 3.15 mm stainless steel tubing leading to the gas chromatographs.
Both air flows were connected to a Valco 9-port, 8-position stream
selection valve along with two calibration gases. Both standards
and samples passed through a 3.4 m 1.83 mm OD (1.52 mm ID) Nafion
dryer, which was mounted inside an aluminum cylinder and was purged
with dry gas from the backflush carrier vent of GC channel 2.

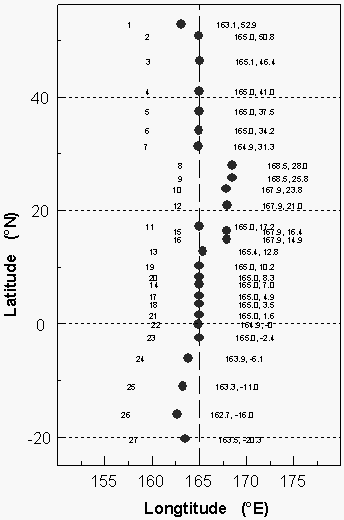
A total of 27 pairs of flask samples, one each for air and equilibrator headspace, was collected along WOCE line P-13 along 165°E between 54°N and 22°S for the determination of gases other than the compounds included in this report, and to compare flask data with those from in situ analyses (Figure 4).
Air was collected with a 12 VDC battery operated KNF Neuberger Model UNO5SVI pump, connected to a 3 m 6.35 mm stainless steel tube, which was pointed into the wind during sampling, All air samples were collected from the forward D-deck in front of the bridge. Most flasks were 0.8 to 1.0 l in volume, electropolished inside and filled with Niwot Ridge (NWR) air before the cruise to minimize surface effects inside the canisters.
Flasks with two valves were purged with ambient air for 10 to 20 minutes at a rate of about 1 l min-1, then pressurized to about 2800 hPa overpressure. Flasks that were equipped with only one valve were pressurized to about 2800 hPa overpressure and released to ambient pressure ten times before they were finally filled and capped. All flasks were analyzed on an HP GC / mass spectrometer (GC/MS) between four and six months after completion of the cruise [Montzka et al., 1993]. All flask data of N2O in this report were derived from a GC/ECD system [Elkins et al., 1993].
HCFC-22 was used as a refrigerant throughout the ship and could be detected at elevated levels on all decks and in all laboratories. Although the tube for flask sampling was extended over the side of the ship into the relative wind, contamination could not be prevented in a significant number of flasks. These contamination events are likely caused by machine room exhaust ports located on the ship's bow interfering with our sampling. Because of heavy weather and, accordingly, extreme ship motions throughout the cruise, we were not able to take samples at the very forward point on the bow, as continuous air sampling was done.
CFC-12, CFC-11, CFC-113, CH3CCl3, CCl4,
and N2O were measured with a custom-designed, three
channel gas chromatograph (GC). New technology was adapted from
our ACATS aircraft projects during AASE II / SPADE for the design
of this GC to minimize space requirements (Figure 3) [Elkins et
al., 1995]. All ECDs and GC columns were mounted in separate,
insulated, 13 cm 8 cm diameter aluminum cylinders.
This modular system was designed for isothermal operation, small power consumption, and easy exchangeability of units. Samples were injected by Valco 12-port, two position stainless steel valves, which operated in both 12-port (CFC-12) and 10-port mode (all other gases). All injection valves were enclosed in an aluminum housing and attached to a 20 cm 10 cm 1 cm aluminum plate heated to a constant 70°C. Electron capture detectors of the 63Ni type, operating in constant current mode, were supplied by Valco and Shimadzu. Electrometers from the commercial Shimadzu GC type Mini-2 were modified to provide a pulse frequency output. They were housed in pairs in specially prepared, aluminum diecast boxes mounted close to the ECDs.
Samples or calibration gases were injected simultaneously into all three GC channels at 10 to 12 minute intervals. The system operated a sequence of four incoming gases, calibration gas 1 (CAL-1), ambient air (AIR), calibration gas 2 (CAL-2), and equilibrator headspace air (EQ), yielding a repetitive injection cycle of 40 to 48 minutes. This injection frequency provided a minimum of one datapoint each for air and surface water every 0.19 degrees of latitude (21 km) considering the maximum steaming speed of the ship. CTD stations or slower speeds enhanced the data coverage per degree.
Channel 1 was intended for analysis of HCFC-22, employing the oxygen doping method to enhance the ECD's sensitivity to this compound [Grimsrud et al., 1978]. This approach yielded a signal to noise ratio of about 10:1 for a direct injection of 5 cm3 of ambient air in our laboratory tests prior to the cruise, requiring no preconcentration. However, the ECD was sensitized by oxygen doping so highly that during the cruise the baseline responded to the ship's motion, showing a sinoidally modulated baseline with amplitudes larger than the original HCFC-22 signal. Numerous tests were conducted during the cruise, in an attempt to isolate the source of these oscillations. After carefully exploring all possible electronic and gas chromatographic interferences, including radio frequency effects on the signal cables, gas flow changes, and oxygen mixing efficiency, we concluded that the problem was most likely caused by motion-induced fluctuations inside the ECD cell, made visible by enhancing its sensitivity through oxygen doping, and would not be solved during this mission. Therefore, we developed a new method for the determination of HCFC-22 during the course of the cruise (section 3.4), and converted channel 1 to measure CFC-12. Consequently, CFC-12 was not measured continuously until day of year (DOY) 243 and there is a lack of data for HCFC-22 measurements north of 28°N.
The OAXTC GC system contained all gas purifiers as well as all electronic equipment needed to operate the GC, such as DC power supplies for electrometers, solenoid valves, fans, computer boards, an AMPRO miniaturized, 80286-based micro computer, ethernet board, and a set of six boards for data acquisition and digital control of the GC system, designed at NOAA's Aeronomy Laboratory [Thompson, 1991]. A program written in QuickBasic was used for data acquisition and system control. The ECD's pulse frequencies were collected 8 times per second and bunched on-line to four data points per second. Some engineering data (temperatures, pressures) were also collected (section 3.5).
| . |
| CFC-11, CFC-113, |
|
|
| ECD manufacturer | Valco | Shimadzu | Shimadzu | Valco |
| ECD standing current | 100pA | 1.6 nA | 1.6 nA | 100 pA |
| ECD temp./Oven temp. | 350°C / 50°C | 350°C / 58°C | 350°C / 60°C | 250°C / 55°C |
| Carrier gas | N2 | N2 | 5% Ar/CH4 | N2 |
| Backflush Column | 3.15 mm OD /
0.8 m | 3.15 mm OD / 1.8 m | 3.15 mm OD / 1.8 m | 3.15 mm OD / 0.8 m |
| Main Column | 3.15 mm OD / 2.7 m | 3.15 mm OD / 4.0 m | 3.15 mm OD / 4.0 m | 3.15 mm OD / 2.7 m |
| Packing material | Porasil B 80/100 mesh | OV 101 / 60/80 mesh | Porapak Q 80/100 mesh | Porasil B 80/100 mesh |
| Backflush flow | 25 cm3 min-1 | 32 cm3 min-1 | 28 cm3 min-1 | 45 cm3 min-1 |
| Main flow rate | 40 cm3 min-1 | 50 cm3 min-1 | 40 cm3 min-1 | 45 cm3 min-1 * |
| Backflush time | 240 s | 280 s | 210 s | 270 s |
| Retention time (s) /
peak width base (s) / peak width 1/2 height (s) / peak:noise (3) | 350/40/400 | CFC11: 210/24/10.6/260 CFC113: 255/28/11.5/43 CH3CCl3: 475/50/19.2/20 CCl4: 545/60/21.0/24 | 360/45/13.5/110 | 630/60/35 |
| Sample loop volume | 5 cm3 | 3 cm3 | 3 cm3 | 35 cm3 |
In addition to the three-channel GC, we built a fourth gas chromatographic channel for the determination of HCFC-22, using the same technology as described above. The unit was intended to be used exclusively for the deepwater measurements of HCFC-22. However, because interferences by the ship's motion on channel 1 precluded the measurement of HCFC-22 as planned, this unit was used mainly for air and surface water measurements. The major differences in this approach were the use of a 35 cm3 sample loop mounted in series with the sample loops of channels 1-3, a preconcentration step where this large volume was focused on a trap, and the subsequent analysis in an ECD identical to that on channel 1, but not nearly as sensitized with oxygen. Hence, the signal to noise ratio was elevated and the detector was less sensitive to the ship's motion.
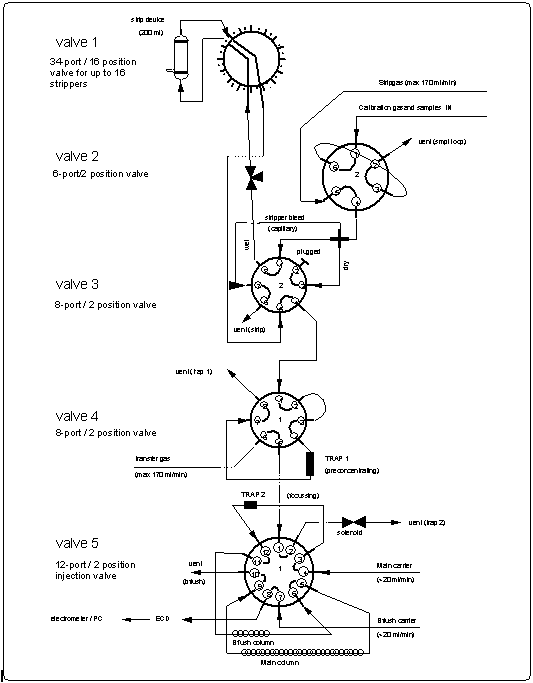
The HCFC-22 system was a one channel GC linked only to power supplies and gas purifiers of the air/surface water GC. Initially designed to operate with two traps for preconcentrating and focusing the sample, the system was ultimately used with only one trap (Figure 5).
Trap materials ultimately used for these analyses were Porasil B (Waters) and Unibeads 2S (Alltech), which required trapping at -50°C for HCFC-22. Low temperatures were obtained using a Neslab CC-65-II Cryocool Immersion cooler to cool 2-propanol in a 1 l Dewar. This system, which alternately trapped and injected samples, was run in a 12 minute cycle in parallel with channels 1-3. Gas chromatographic settings of channel 4 are included in Table 1. Oxygen dopant was maintained at 0.75% O2 by adding a stream of 5% oxygen in nitrogen at a rate of 8 cm3 min-1 to the nitrogen carrier gas. This method resulted in a signal to noise ratio of around 35:1 for an ambient air injection and a lower detection limit for HCFC-22 of 10 ppt (3xstandard deviation (STD) of noise).
Seawater to be analyzed was usually sampled in 10 l Niskin bottles. After returning the cast to the deck of the ship, an aliquant of 100 ml was transferred from the bottle to ground glass precision syringes after they had been flushed several times with small amounts of seawater [Bullister et al., 1988]. For GC analysis of deepwater samples, the 35 cm3 gas sample loop was replaced with a glass stripper that contained the sampled deepwater. A nitrogen flow of 100 cm3 min-1, entering through a fine glass frit for five minutes, purged the dissolved gases through a desiccant (Aquasorb, Mallinkrodt) and a column for CO2 removal packed with Ascarite (Thomas) onto the precooled trap. The sample was then injected onto column as described above.
Along with GC data, we collected engineering data and obtained position and meteorological data from the ship. Sea-surface and equilibrator temperature were at first measured with custom built 10 k thermistors. As these were degraded by seawater, they were replaced after the Kwajalein port stop with stainless steel housed ON 410 PP thermistors (Omega) to give better reliability of operation. All thermistors were directly connected with the system's A/D converter. Temperatures were sampled every second and displayed on-line as a 30 second average along with the temperatures of the laboratory, the cold bath for the HCFC-22 measurements, and the electronic unit of the GC system. Pressure at the end of the sample loops was monitored with a P120 (Micro Gage Inc) pressure sensor, connected to the A/D board of the system.
Position data were logged every ten minutes by two global positioning systems (GPS) aboard the Vickers. Because of some downtime on those systems, the available data were combined to one data set and then interpolated to give the most precise position for each injection. Relative wind directions and universal time were logged along with the position data. Absolute wind direction was read and logged by the ship's personnel every hour except on stations. Those data were added to the databases at interpolated intervals representing the times of injections. The same was done for wet and dry air temperatures and the ambient pressure taken from mechanical devices on the ship's bridge.
HCFC-22 data from channel 4 were analyzed on an 80486-based PC with OMS Tech's ELAB integration software and commercial spreadsheet programs. All other data from the air/surface water system were stored in one large ASCII file on the system's hard disc drive and downloaded to other computers about every eleven hours or 60 injections. Approximately 1300 megabytes of rawdata were generated during the entire cruise, representing 8200 injections per channel and a total of 26000 chromatograms (incl. channel 4). This yielded a data set of about 1500 useful data points per gas each for air and surface water (150 for HCFC-22).
Data from the air/surface water system were downloaded to Apple/Macintosh computers and analyzed with the data program IGOR (WaveMetrics Inc.) with custom software NOAHchrom for both integration of chromatograms and database analysis. This software, written in C and compiled to IGOR usable functions, enabled us to set specific flags for single data points such as "ship on station", "equilibrator off", or "bad chromatogram", providing useful tools for advanced data review and evaluation.
After excluding data points that were out-of-sequence, test-injections, or the result of bad chromatograms and equilibrator data that were collected when the seawater supply was shut off, the remaining data set was browsed for possible contamination events. Data collected during trailing winds were flagged to indicate possible contamination of CFC-12, CFC-113, HCFC-22, or CH3CCl3. (High levels of those gases were detected in both the main lab and on all decks but no enhancement in carbon tetrachloride could be detected under these conditions). Whereas most samples of a wind direction that was critical regarding contamination were actually not contaminated, some were and thus were removed from the dataset. Data taken during a ship stop, usually for CTD casts, ship repairs or deployment of deepwater floats, were also flagged. Although the ship's bow was usually kept into the wind, the relative wind speed was low compared to underway movement; hence, contamination was more likely. Flags were also set for events associated with hardware changes. All outliers that could be traced to these events were removed. The last step in data reduction was removing statistical fliers. These were data that deviated more than three standard deviations from the average of points in their immediate vicinity. This was done by re-defining the range with each pass until no more data points could be removed (recursive filtering, Butler et al., 1988b).
All measurements were calibrated using either gravimetrically prepared standard mixtures or natural air, collected at Niwot Ridge, Colorado, that was calibrated with gravimetrically prepared standards. All standard gases were held in Aculife™ treated aluminum cylinders, except for standards KR4365 and KR4357, which were stainless steel cylinders. Hence, because we measured mole fractions (as our standards are based on a weight measurement), in this publication we report mixing ratios by mole fraction (e.g. ppt), not by volume (e.g. pptv).
Standard gases were recalibrated after the cruise to ensure better accuracy. The absolute accuracy of our calibrations is estimated at 2% for CFC-11, CFC-12, and N2O, about 5% for methyl chloroform, carbon tetrachloride, CFC-113, and HCFC-22. The precision (1) for those recalibrations was 0.2% for CFC-11, 0.4% for CFC-12, 3% for CFC-113, 1.3% for CH3CCl3, 1.0% for HCFC-22 and 0.8% for CCl4. The precision of our underway air measurements is of the same magnitude, except for HCFC-22, which was 3%. Comparison of calculated pre-cruise values for the standard gases with those obtained during recalibration after the cruise agreed to each other within three percent, except for carbon tetrachloride in standard tank ALM26746, which was not stable. The post-cruise value was 37% lower than the pre-cruise concentration. CMDL/PMEL intercalibration runs conducted during the Kwajalein port stop yielded a value that, combined with pre-and post-cruise data, suggested a linear drop in the carbon tetrachloride concentration. This drift was taken into consideration in calculating CCl4 concentrations, yielding a final estimated uncertainty of less than 2%.
During the cruise, we used a total of five calibration gases, two at a time, three of which were changed on DOY 246.6, 256.4 and 279.4. Small steps in the concentrations of the data were encountered due to these changes, but were within the accuracy of our calibrations. Minor adjustments were made for CFC-12, methyl chloroform, and carbon tetrachloride in order to get a consistent data set.
| . | ||||||
| CFC-11 | ||||||
| CFC-12 | ||||||
| CFC-113 | ||||||
| CH3CCl3 | ||||||
| CCl4 | ||||||
| HCFC-22 | ||||||
| N2O |
For most compounds, we added data from the CMDL station network for comparison. Locations of the stations Niwot Ridge (NWR 40.0°N, 105.6°W), Mauna Loa (MLO 19.5°N, 155.6°W), and American Samoa (SMO 14.2°S, 170.6°W) overlap with the cruise track and are included in the figures.
The mixing ratios of all gases were determined as ratios of peak areas to two different adjacent standards. Assuming a linear response in the vicinity of the calibration gases (but a non-zero intercept of the response curve), we used the response factors of the two standards to compute mixing ratios for the samples by interpolating between them according to equation (1).
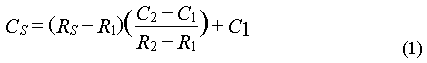
where C and R refer to concentration and response and the subscripts S, 1, and 2 refer to sample, standard 1, and standard 2. Responses R1 and R2 for the standards were calculated from two points each, which were weighted according to their distance from the sample point. This 2-standard, 4-point method thus corrected for drift as well. Changes in atmospheric pressure were not corrected, because they usually occurred slowly compared to the sampling frequency. The difference between maximum and minimum observed pressure during the cruise was 38 hPa or 3.8%. The maximum change in pressure was no more than 1.9% per day or 0.6% per injection cycle of 48 minutes. Most of these changes were factored out with the drift correction.
Owing to a high non-linearity in the oxygen doped detector, we used a quadratic calibration method for the computation of HCFC-22 mixing ratios (X) in air and surface water with the response ratio to the calibration gas (R) according to the equation
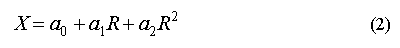
with a0 = 0.13, a1 = 282.74, and a2 = -133.53. For the calculation of this quadratic curve we used average response factors of the standards along with an equally weighted zero intercept [Butler and Elkins 1988a].
For the deepwater HCFC-22 measurements, we used a one standard, one point calibration with cylinder CLM3822, which contained 4.2 ppb HCFC-22. Injection of 2 cm3 of this calibration gas approximated the amount of HCFC-22 stripped from 100 ml of surface seawater.
Equilibrator data required a correction to account for warming of the water between the scientific sea water intake and the equilibrator that occurs because of insufficiently insulated tubing and exposure of the equilibrator to the sunlight on deck. Warming of the water results in elevated partial pressures measured in the headspace of the equilibrator. This effect is small, but is easily corrected by computing a coefficient from the ratio of solubilities at two temperatures [Murphy et al., 1993; Butler et al., 1988b]. Typical values for warming range from 0.2°C in warm waters to 0.8°C in cold waters.
Actual warming was calculated from one hour averages of both sea-surface and equilibrator temperatures from those parts of the cruise where both thermistors were fully functional. From these data, we calculated a linear, least squares fit of warming versus actual sea-surface temperatures (Figure 6c). Warming was then computed from this relationship for every point during the cruise (Figure 6d). For the final correction of equilibrator data, we used solubility coefficients and their temperature dependence listed in Table 3.
| . | |||||||
ß35‰,25° | |||||||
(y) |
(46-63)$ |
(105-200)$ |
(12.1-15.5) †† |
{ | @ | ||
(105 cm2 s-1)† |
In equilibrium, the partial pressures of inert halocarbons in the surface waters should be the same as they are in the atmosphere. However, because of physical processes that affect the surface saturations, the gases are not exactly in equilibrium, but rather in steady-state. For example, waters that have been warmed by solar radiation are generally supersaturated with the CFC's because gas evasion cannot keep pace with the rate of warming and the accompanying decrease in solubility. Likewise, waters that have been cooled significantly can appear undersaturated with these gases. Air injection by bubbles from waves and whitecaps tends to supersaturate all gases to some extent, and mixing of different water masses can lead to over or undersaturations. Thus, the departures of surface concentrations of CFC-11 and CFC-12 from equilibrium, referred to as saturation anomalies, are directly attributable to physical processes, and can be used to factor out physical effects for gases that are not conservative in seawater, such as CH3CCl3 and CCl4.
The saturation anomaly for a dissolved gas is expressed as the percent departure of the observed dissolved amount from equilibrium. This is computed from the difference in partial pressures :
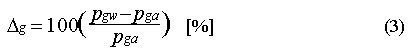
where pgw and pga are the partial pressures of the gas in water and air. If the saturation anomaly of a gas is positive, it indicates that the gas is leaving the water. If it is negative, then the gas is entering the ocean from the atmosphere. However, the saturation anomaly alone is not sufficient for detecting or estimating in situ consumption in the water. This is because of physical processes that can give rise to positive or negative saturation anomalies [Kester 1975]. The magnitude of this effect depends upon the diffusivity of the gas, its solubility, and the temperature dependence of its solubility. In practice, the difference in saturation anomaly for similar compounds is small; saturation anomalies for CFC-11 and CFC-12 typically differ by 1-3%. Their molecular diffusivities are not much different, nor is the temperature dependence of their solubilities, but their absolute solubility differs by a factor of 3.5 (Table 3).
Consequently, to determine if there is any loss of a gas in the water, we compute net saturation anomalies for all gases. This is done by subtracting the CFC-11 saturation anomaly from the observed anomaly for each gas. CFC-11 is chosen over CFC-12, because its physical properties more closely resemble those of the other gases than does CFC-12, which is much less soluble and has a smaller change in solubility with temperature (Table 3). Calculated this way, a net saturation anomaly that is negative indicates that the gas is probably being consumed in the water, regardless of its non-corrected anomaly. However, because of the differences in physical properties of various gases, in situ consumption is more probable if the net saturation anomaly is less than -2%. For N2O, such a correction for physical processes cannot be applied, because CFCs are depleted at depth whereas N2O is produced at depth [e.g. Butler et al., 1988a, b]. Hence, all saturation anomalies that are due to vertical mixing would yield incorrect results, if a CFC-correction was applied.
The net saturation anomaly should be roughly proportional to the in situ loss or production of the gas. If we assume steady-state conditions, the loss or production rate can be calculated from the flux of the gas across the surface of the water that is required to maintain the observed net saturation anomaly:
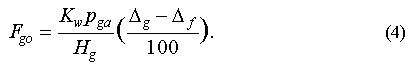
Here Fgo is the loss rate for the gas to the ocean (mol m-2 d-1), Kw is the air-sea transfer velocity (approx. 4 m d-1), Hg is Henry's Law constant for the gas (m3 atm mol-1), pga is the partial pressure of the gas in the atmosphere, deltag is the saturation anomaly of the gas and deltaf is the saturation anomaly of CFC-11. There is some uncertainty in this kind of flux estimate, mainly because Kw is known only to around 50% and varies considerably with wind speed and sea-surface roughness, but also because the CFC-11 correction is only an approximation. For our estimates, Kw was calculated from Wanninkhof [1992]:
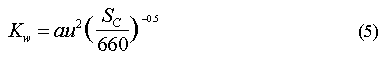
where a is an empirically derived constant (0.39 for long term winds, 0.31 for instantaneous winds), u is the wind speed, and Sc is the Schmidt number, a dimensionless number defined as the kinematic viscosity of water divided by the molecular diffusivity of the gas in water at a given temperature. The constant 660 is the Schmidt number for carbon dioxide in seawater at 20°C. For our data, we derived the Schmidt number from diffusivities calculated from Hayduk and Laudie [1974], using sea-surface temperature and wind speeds observed during the cruise and averaged over 10° latitudinal bands.
The relative contribution of some in-situ loss in the ocean as a sink for an atmospheric gas can be estimated from the following equation:
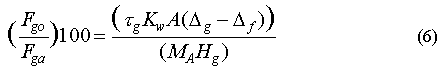
where Fgo is the loss rate to the ocean, Fga is the total loss rate from the atmosphere (both in mol m-2), taug (d) is the atmospheric lifetime of the gas, A is the area of the ocean over which the saturation anomaly is averaged (m2), (deltag-deltaf) is the net saturation anomaly of the gas (%), and MA is the mass of the atmosphere (mol atm-1). Use of this equation requires that the downward removal term [Butler et al., 1991; Johnson 1981] is small, which, for this group of gases, is true.
If we assume that a negative net saturation anomaly is solely the result of in situ losses, that the correction for physical effects is adequate, that the system is in steady-state, and that removal during downward transport (e.g. chemical or biological consumption at depth) is small, then it is possible to estimate a pseudo-first-order loss constant for the reaction
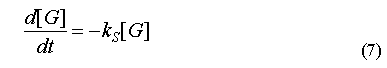
in the surface water, where d[G]/dt is the decrease in concentration of gas G with time. ks is the pseudo-first-order loss constant calculated by equating the rates for gas transport across the surface (equation 4) and in situ loss derived from equation 7, which is permissible under steady-state conditions:
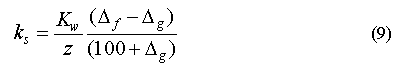
Solving for ks yields
In our calculations, Kw was derived from locally averaged wind speeds (10° bands) and z was taken as 125 m in tropical waters and 100 m in Central Pacific waters [Li et al., 1984].
Figure 6a shows the smoothed sea-surface temperature (SST) along with dry air temperature. Air temperature (AT) was in general lower than the SST between 34°N and 13°S. For the remainder of the cruise, SST was equal to or lower than the AT. SST and, hence, warming was greater in the East Pacific Ocean than in the West Pacific. The cruise started at the beginning of August, which is close to the time when the northern Pacific is warmest. Similar latitudes to those in the Gulf of Alaska were crossed in the West Pacific during early September, one month later. The coldest temperatures at about 8°C were observed in the Bering Sea, sharply increasing by 5° at about 35°N, then steadily increasing once we started the line P13 along 165°E and peaking between 10°N and 5°S; hence, the maximum warming still occured in the northern hemisphere (NH). The North Pacific had been warmed during the summer and was starting to cool, while the waters of the southern hemisphere (SH) were about to heat up. Temperatures at Noumea, New Caledonia (23°S) were similar to those at 37°N.
Whereas the general wind direction relative to the ship (Figure 6b) was mostly between 300° and 60° over the bow, we did observe some winds blowing over the stern or from the side. About 11% of all data were taken in winds between 90° and 270° (180° angle) relative to the ship's heading, 3% of the data were taken in winds between 135° and 225° relative to the ship (90° angle), and only 1.8% of the data were collected with the wind from the stern. Ten minute averages of absolute wind speed, measured at about 12 m above sea level, did not exceed 17 m s-1 and the mean wind speed for the entire cruise was 7.74 m s-1.
CFC-11 and CFC-12 are anthropogenic halocarbons that have long atmospheric lifetimes and are inert in seawater. Hence, they are extremely useful as tracers of physical processes. Their analysis is an integral part of WOCE, where they are used to trace the motion of deep circulation and to date the waters based upon their atmospheric imprint made at the time the waters sank or mixed downward from the ocean surface. These two halocarbons are also useful in evaluating atmospheric circulation, and in determining the effects of physical processes, such as mixing, heating, cooling, and bubble injection, upon air-sea exchange.
Figure 7b demonstrates the variability in the mixing ratio of
a physically controlled gas that can be expected during an extended
period of measurements as done on this cruise. Upon crossing the
Gulf of Alaska and entering the Bering Sea (DOY 223-226), we observed
very low partial pressures of CFC-11 in the surface water. Higher
values were noted after exiting the Bering Sea and proceeding
south (DOY 236-240). The difference between the East and West
Pacific is largest at about 50°N (Figure 7c) and is reflected
in both water and air values, although to a much lesser extent
in the air. Wind trajectory analysis of two points around 50°N
(T1 and T2) reveal different air masses influencing the areas
of interest. Air over the Gulf of Alaska was almost stationary
and well isolated for about six days. The air was clean, as it
previously originated from the north central Pacific. Assuming
that the Gulf was supplied with this type of air for several weeks
(giving the water enough time for equilibration), this would explain
the observed low partial pressures. Air masses over the West Pacific
at DOY 238, in contrast, were supplied from the Asian continent,
in particular Russia and China. Continental air masses usually
carry enhanced levels of CFCs, which might explain the observed
high mixing ratios of gases at this point in both air and water.
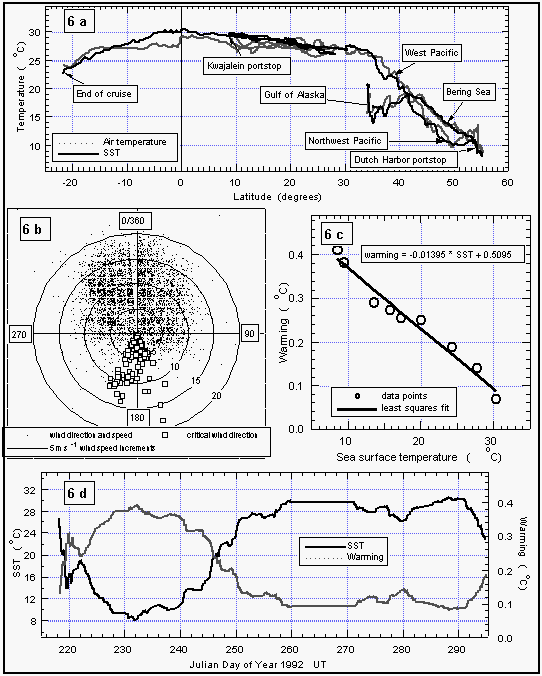
Figure 6: (a): Sea-surface and air temperatures. (b): wind speed and direction relative to the ship's heading (0/360°). Concentric circles around the origin are increments of 5 m s-1. Data points with a wind direction of 180±30° are marked as white squares. The "V" shaped gap in the data set is an artifact created by a pole in front of the anemometer. (c): Correlation of sea-surface temperature and warming of the equilibrator water. (d): Sea-surface temperature (smoothed) and warming (calculated from the equation in 6c). [Click on the thumbnail to retreive a large version of the image (20 kb)]
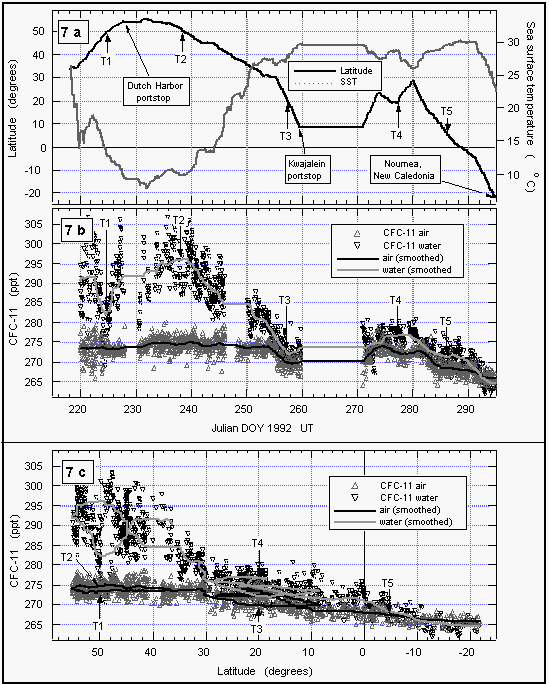
Between DOY 240 and 260, CFC-11 mixing ratios reflect the southerly proceeding of the cruise. The partial pressure of CFC-11 in the water decreased with latitude because there was less relative warming near the tropics and subtropics during the summer compared to that at higher latitudes. Mixing ratios in the air also dropped with latitude, reflecting a source-driven, interhemispheric gradient of CFC-11, indicative of mainly NH emissions. On DOY 260, the ship reached Kwajalein at 8.8°N.
After leaving this port 11 days later, the ship steamed north to 26°N, a little south, and again north to 28°N (Figure 7a) before finally continuing south. During this part of the cruise, we crossed some latitudes between 10°N and 30°N up to four times and observed significantly different values compared to those before DOY 260. The difference in air was about 4 ppt, in water about 6 ppt. These differences are, again, made clear by trajectory analysis of a point at 20°N on DOY 257 and 277 (T3 and T4). A 10-day wind trajectory at DOY 257 shows air coming from southwest latitudes around 0 to 10°N, where the interhemispheric tropical convergence zone (ITCZ) is expected to carry a mixture of (low concentrated) southern hemispheric and (high concentrated) northern hemispheric air. Thus, the measured mixing ratios were lower than an average at this latitude would suggest. A wind trajectory for this point on DOY 277, on the other hand, shows air being transported from the north central Pacific into this region. This northern hemispheric air, with higher levels of CFC-11, was probably more representative for this latitude. Finally, several trajectories beyond DOY 286 (5°N) reveal an increasing influence of southern hemispheric air, reflected in lower atmospheric CFC-11 mixing ratios. Partial pressures of CFC-11 in the water were lower than air values south of 10°S as a consequence of the increasing effect of cooling in the southern hemisphere.
In summary, CFC-11 behaved predictably in both the atmosphere and the surface water. Apparent large scatter in the latitudinal profiles of compounds (Figures 8, 9, 12, and 15) between 55°N and 44°N as well as 28°N and 8°N can be explained in part by air mass movement and temporal variations (Figure 7c) and must be taken as the expected variability in the mixing ratios of such compounds.
Atmospheric mixing ratios from the in situ measurements of CFC-11 agreed well with those from flask samples collected on the ship and agreed within one standard deviation with data from in situ measurements of three CMDL network sites (Figure 8). Most flask data between 8°N and 30°N were taken on our first pass across this region (see also Figure 4), hence show values on the lower end of the variability.
CFC-11 mixing ratios did not drop significantly until 30°N, and leveled out below 10°S. Saturation anomalies were highest in the northern hemisphere, where the waters had been subjected to warming throughout the summer. Below 10°S, the saturation anomaly was negative for CFC-11. From cooling alone, one might expect negative anomalies south of the equator, but effects of cooling are offset to some degree by air-injection, which tends to supersaturate all gases [Wallace and Wirick, 1992]. In fact, relatively high wind speeds were observed throughout the West Pacific (Figure 6b), including regions south of the equator, indicating a possibly significant effect of bubble injection and white caps. Negative anomalies are likely below 20°S, as cooling would become the predominant physical process regulating the gas saturations.
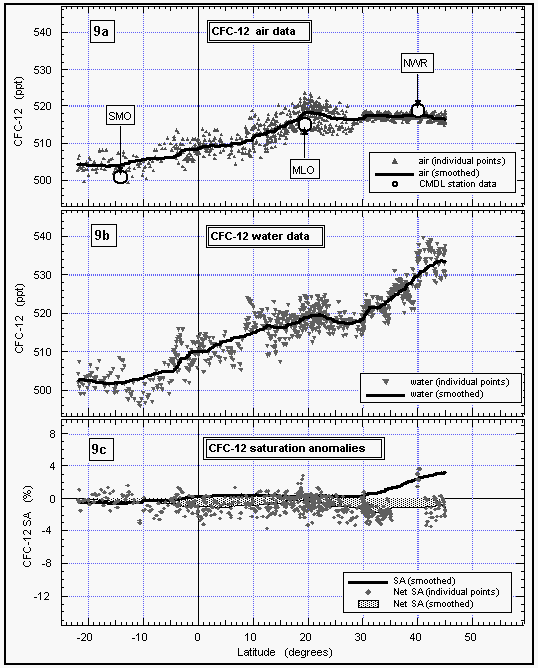
CFC-12 data show basically the same effects as explained for CFC-11 (Figure 9). CMDL station data from Niwot Ridge, Mauna Loa, and American Samoa agree with our in situ data set within one standard deviation.
Saturation anomalies of about 3% were observed for CFC-12 in the
north and close to zero below 30°N (Figure 9c). CFC-12 is
affected only by physical processes, as is CFC-11, so its saturation
anomaly should not differ substantially from that of CFC-11, and
its net saturation anomaly should be near zero. The calculated
values are, indeed, between zero and -2% and likely represent
the effects of slightly different behaviors of physically controlled
gases.
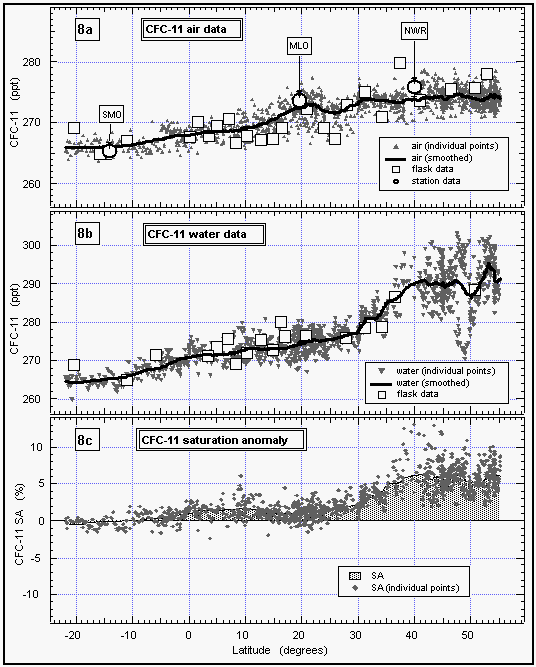
Figure 8: Latitudinal profile of CFC-11 mixing ratio in the air (a) and its partial pressure in the sea water equilibrator (b). Part (c) shows the saturation anomaly of CFC-11. All values were smoothed using a latitudinal sort order instead of the time series of Figure 7c. Station data reflect a three month average of in situ measurements from August through October 1992. [Click on the thumbnail to retreive a large version of the image (21 kb)]
As with CFC-11 and CFC-12, the mixing ratio of HCFC-22 in the atmosphere decreased with latitude from 30°N (108 ppt) to the equator, where it tended to level off with latitude at a value of 98 ppt. This is consistent with recently published results from the NOAA/CMDL flask sampling network that are included in Figure 10 [Montzka et al., 1993]. Data from flasks taken during the cruise extend the data set of in situ measurements to about 40°N, and agree with our in situ data set within 1.5 standard deviations. They are also in very good agreement with flask data obtained from the stations, which further shows that HCFC-22 has a latitudinal profile similar to those of the CFCs. The latitudinal gradient that we observed for HCFC-22, on the order of 12 ppt between 40°N and 22°S, is consistent with the interhemispheric difference of 13 ppt reported by Montzka et al. [1993] and suggests a growth rate of about 5 % yr-1.
The net saturation anomaly of HCFC-22 in temperate waters does not appear to differ largely from those of the CFCs, but it is negative in tropical waters. This would be expected for weak hydrolysis of HCFC22, although other temperature-dependent processes cannot completely be ruled out. It also is possible that the saturation anomaly, which is not much more negative than that of CFC-12, is, in part, a function of differing physical properties, such as solubility, diffusivity, and the temperature dependence of these functions. As for CFC-12, a deviation from CFC-11 on the order of 2% should be expected. The average net saturation anomaly for HCFC-22 for all observations is -2.9%. A data set extending to more northern and southern latitudes would most probably reveal a smaller value for the global net saturation anomaly. Considering only latitudes between 20°N and 20°S, on the other hand, yields an average of -3.7%, which is more negative than expected from variability in physical behavior, indicating a small tropical sink for HCFC-22.
In addition to our air and surface water measurements, we obtained deepwater profiles of HCFC-22 in tropical waters (Figures 11 a and b). For comparison, we present profiles of CFC-11 and CFC-12, which were measured by NOAA/PMEL [Bullister et al., 1992]. Profiles for CFCs 11 and 12 of station 74 reveal a constant concentration throughout the mixed layer, dropping off sharply at about 200 m depth to reach values near zero at about 700 m. At station 77, the drop-off is rather smooth compared to station 74.
HCFC-22 qualitatively follows this behavior at both stations, although the precision for these measurements is worse than those for the CFCs and the smaller number of data points do not show details observed in the CFC profiles. Figures 11 c and d show a better comparison of the profiles by normalizing them to their surface water value. Again, within the uncertainty of our measurements, differences in the profiles must be considered insignificant and do not reveal any hard evidence of sub-surface breakdown of HCFC-22.
Adapting the definition of the Henry's law constant Hg
= pga / cgw with cgw
being the concentration of the gas in the water, and the values
for Hg calculated for the mean observed surface
water temperature of 30.3°C for stations 74 and 77, we expect
water concentrations of 2.72 nmol m-3, 1.67 nmol m-3,
and 0.92 nmol m-3 for HCFC-22, CFC-11, and CFC-12,
considering air values of 98 ppt, 271 ppt, and 509 ppt, respectively.
Calculated water concentration ratios relative to HCFC-22 were
1.6 and 3.0 for CFC-11 and CFC-12, close to the observed surface
water ratios on those stations of 1.7 and 3.0.
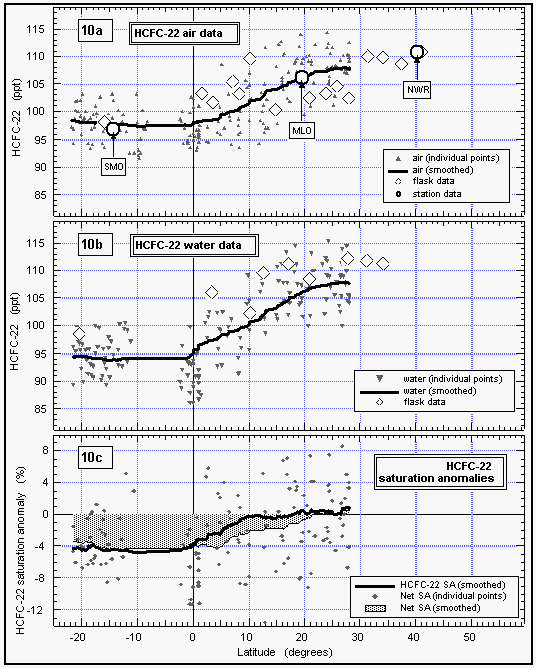
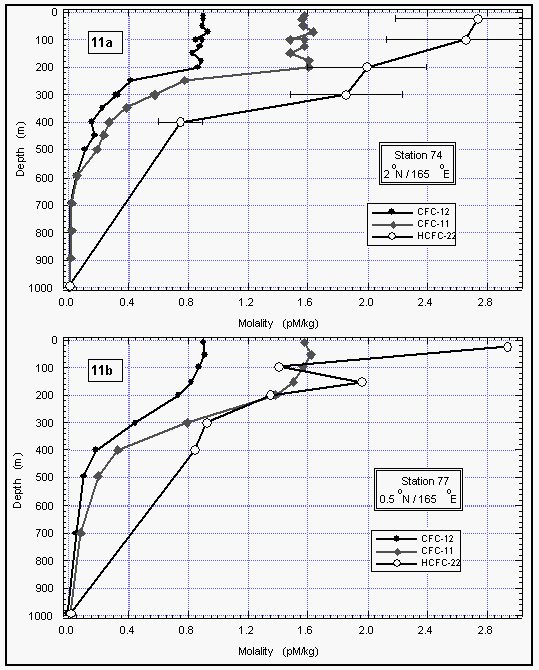
Figure 11c d: Deepwater profiles of HCFC-22 for two stations in the tropics (a and b) and the same profiles normalized to their surface water value (c and d). Error bars on HCFC-22 indicate an accuracy for those measurements of 15% of the surface value, which covers the observed instrumental blank of about 25% of the surface value. [Click on the thumbnail to retreive a large version of the image (17 kb)]
Atmospheric mixing ratios of methyl chloroform remained constant in the air, as did the CFCs, until 30°N and then decreased from about 150 ppt to 126 ppt at 8°N (Figure 12). Mixing ratios remained almost constant from 8°N into the southern hemisphere. Flask data support the same findings and agree very well with the in situ dataset. Low mixing ratios in flasks with air collected between 15°N and 28°N reflect the lower atmospheric concentrations on our first pass through this region. This difference is more pronounced than for CFC-11, because methyl chloroform has a short lifetime compared to CFC-11, hence, is a better tracer for the influence of southern hemispheric air. The observed differences between the eastern and western Pacific around 50°N were not as significant as for CFC-11.
Simultaneously, water concentrations drop from north to south, but to a much larger extent; values south of 10°N keep dropping until a minimum is reached around the equator. The net saturation anomaly is negative almost everywhere except for the region around 30°N where we observed slightly positive values. Our data show a significant tropical sink centered around the equator, where upwelling and oceanic breakdown by hydrolysis, and maybe by biological activity, is most intense [Butler et al., 1991]. However, on this crossing of the tropics, we observed higher (less negative) values than had on average been observed previously. The average net saturation anomaly between 20°N and 20°S was -4.3%, compared to an average of -11% for the data of Butler et al. [1991].
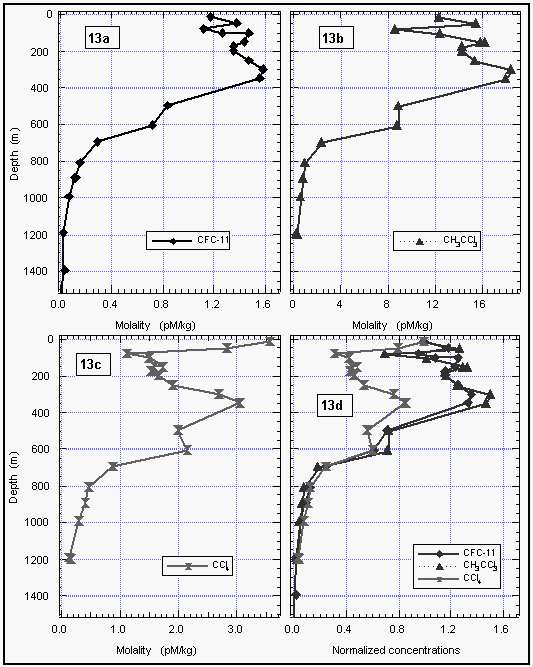
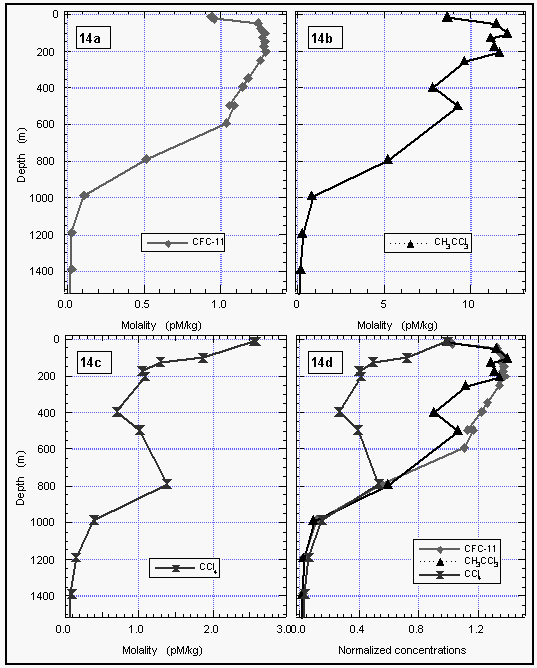
Deepwater profiles for methyl chloroform were obtained by NOAA/PMEL (Figures 13 and 14). Methyl chloroform profiles were similar to those of CFC-11, with a slight increase in concentrations of both compounds before decreasing with depth. Even substructures, visible between 50 and 200 m at station 41, coincided for both compounds (Figure 13d), indicating conservative behavior for methyl chloroform at depth. No subsurface sink could be deduced from water column measurements of methyl chloroform.
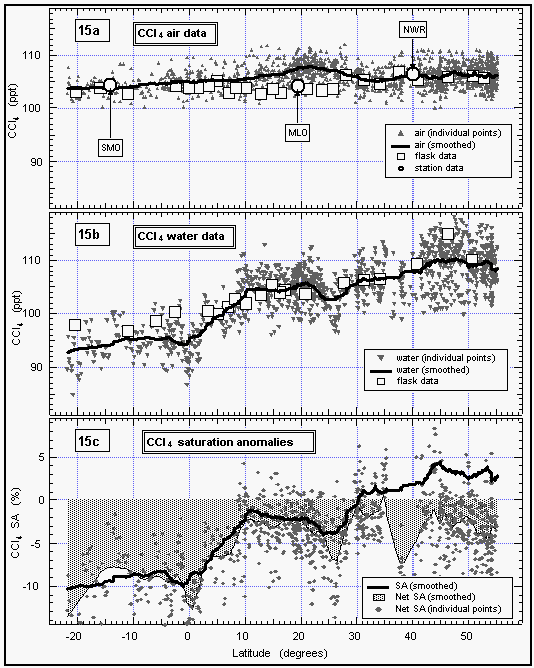
Although CCl4 appears slightly supersaturated at the
higher north latitudes, its net saturation anomaly is strongly
negative at all latitudes, which is also consistent with earlier
findings by NOAA/CMDL [Butler et al., 1993]. Because CCl4 has a fairly long lifetime in the atmosphere, the calculated oceanic flux translates into a loss of about 16%
of atmospheric CCl4 to the ocean. Data from other cruises
indicate that this could be between 15 and 35% [Butler et al.,
1993]. Laboratory hydrolysis data do not support the loss rate
required to sustain the observed saturation anomaly for CCl4.
However, some deepwater profiles obtained by NOAA/PMEL and by
other investigators on other expeditions indicate that CCl4
is consumed at depth below the thermocline but near the oxygen
minimum. The profiles for CCl4 (Figures 13 and 14)
depart from those for CFC-11 between 100 m and 600 m, depending
upon location. The most likely loss mechanism for this is biological
consumption by heterotrophic organisms that thrive in weakly oxic
waters. It also is possible that hydrolysis still contributes
to the removal of CCl4 from the surface ocean, if the
currently published hydrolysis rates are incorrect and the temperature
dependence is small. There has been some dispute recently over
CCl4 hydrolysis rates, and, unlike for CH3CCl3,
interlaboratory agreement is poor [e,g,, Krysell and Wallace,
1988; Jeffers et al., 1989a, b].
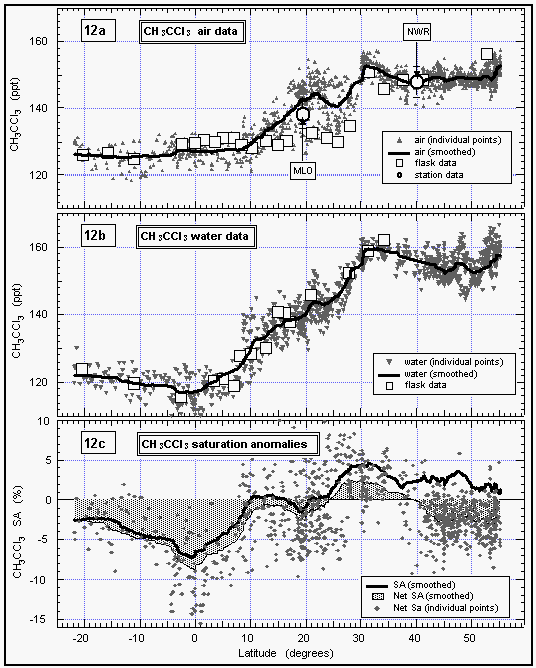
Figure 12: Latitudinal profile of methyl chloroform mixing ratios in the air (a) and its partial pressure in the sea water equilibrator (b), as well as its saturation anomalies (c). Station data reflect a three month average of in situ measurements from August through October 1992. [Click on the thumbnail to retreive a large version of the image (23 kb)]
Atmospheric mixing ratios of CFC-113 (Fig. 16) followed a pattern
similar to those of CFC 11 and CFC 12 (Figures 8 and 9) with
higher mixing ratios of about 84 ppt in the NH dropping off at
1520°N to a lower level of about 80 ppt in the SH.
This pattern, again, is indicative of emissions of this compound
that mainly stem from the NH. Data taken from the NOAA/CMDL cooperative
sites Mauna Loa, Niwot Ridge, and Samoa during the months of the
cruise, agree well with shipboard measurements. Data from flask
samples collected during the cruise are also in good agreement
with the in situ dataset, although some of the samples were contaminated
with CFC-113, which was used on the ship.
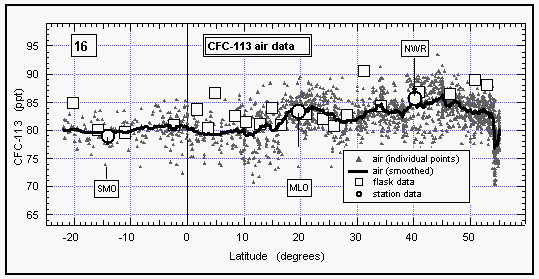
Figure 16: Latitudinal profile of CFC-113 mixing ratios in the air. Station data reflect a three month average of in situ measurements from August through October 1992. [Click on the thumbnail to retreive a large version of the image (10 kb)]
No data could be obtained for CFC-113 in surface waters due to a chromatographic problem. The scientific sea water supply line was assembled with a glue that contained large amounts of methylene chloride (CH2Cl2), which coeluted with the CFC-113 peak, resulting in a useless signal for this compound from injections of equilibrated air.
Mean atmospheric N2O mixing ratios ranged from around
310 ppb in the high northern latitudes to 308 ppb in the
southern hemisphere (Figure 17). These values are consistent with
data obtained at the NOAA/CMDL observatories, although values
from Samoa (SMO) are slightly higher. However, monthly averages
from SMO often are influenced by pulses of northern hemispheric
air and can be expected to be high at times. The overall difference
of 2 ppb between the far north and the far south is consistent
with data from NOAA observatories and is identical to that reported
for SAGA II, an expedition that took place in 1987 along
a similar cruise track in the West Pacific [Butler et al., 1988a,
1989]. Atmospheric mixing ratios from this cruise are, on average,
about 3 ppb higher than those reported for SAGA II. This suggests
a growth rate of 0.6 ppb y-1, which is consistent with
data taken from the NOAA flask network during the same interval
[Thompson et al., 1994].
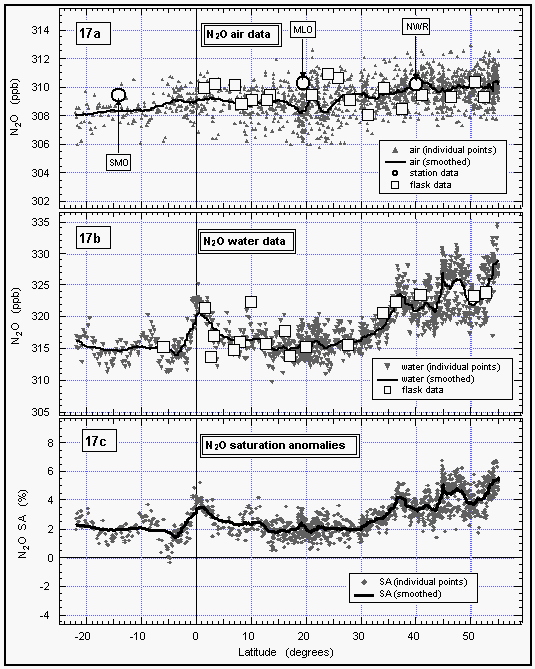
Figure 17: Latitudinal profile of nitrous oxide mixing ratios in the air (a) and its partial pressure in the sea water equilibrator (b), as well as its saturation anomalies (c). Station data reflect a three month average of August through October 1992. [Click on the thumbnail to retreive a large version of the image (24 kb)]
The distribution of dissolved N2O along this cruise track also is similar to that reported for SAGA II, with the highest partial pressures located above 35°N and the lowest values in the central gyres (10°-30° latitude in either hemisphere, Figure 17). On both expeditions the partial pressure of N2O was only slightly elevated near the equator and near a current divergence at 10°S. This is particularly notable in that the W. Pacific transect of SAGA II took place in May, whereas much of the OAXTC transect transpired during September and October. Both years, 1987 and 1992, were El Niño years, which would tend to suppress what little upwelling there usually is in the W. Pacific. Data from both cruises show saturation anomalies of around 2% in the north central gyre, but the saturation anomaly for SAGA II is near zero in the S. Pacific gyre, where the value for this expedition is still 2%. The difference may be the result of differences in seasonal heating of the water or of geographical differences. The OAXTC saturation anomalies for the N.W. Pacific, equator, and 10°S are 5%, 4%, and 3%. For SAGA II these anomalies were 6%, 2%, and 4%, respectively.
Because N2O is produced at depth and brought to the surface by upwelling, its origin is different from that of the CFC's which enter the ocean from the atmosphere. As already mentioned, we cannot use the CFC-11 saturation anomaly to correct for the physical effects upon N2O saturations to compute fluxes; the induced error is likely to be greater than the correction. Nevertheless, the data shown here are consistent with a relatively weak source of N2O from the W. Pacific. They are also in agreement with the SAGA II data and support the notion that much of most of the oceanic source of N2O is derived from the limited areas of divergence and upwelling, rather than from the expansive, central gyres [Butler et al., 1989; Weiss, 1978, 1981; Law and Owens, 1993].
The mean net saturation anomaly of -2.9% for HCFC-22 in the latitudinal range of 20°S to 30°N is not supported completely by current estimates of HCFC-22 hydrolysis. The pseudo-first-order loss constant, ks, required to sustain this saturation anomaly in this region is 110-8 s-1, yielding a mean lifetime in warm surface waters of around 3 years. Calculations, based upon data from McLinden [1989] and Downing [1988], yield a pseudo-first-order rate constant of 1.1510-9 for HCFC-22 hydrolysis in waters of pH 8. No other studies have replicated these results, and no studies have been conducted for hydrolysis of HCFC-22 in seawater, where salt effects, ion-pairing, and specific-ion effects can be significant.
In general, physical effects can be used partly to explain a negative saturation anomaly for HCFC-22 relative to that for CFC-11. The diffusivity of HCFC-22 is larger than that for CFC-11 and the temperature dependence of its solubility is greater (Table 3). As water is warmed, these two effects will tend to counteract one another; the thermodynamic effect of warming tending to give HCFC-22 a more positive anomaly, but the faster diffusion rate tending to lower the HCFC-22 anomaly relative to CFC-11. However, as the water cools, and with both anomalies positive from recent warming, these processes would lower the HCFC-22 anomaly more and do it more rapidly. Lastly, because air-injection from bubbles tends to supersaturate the less soluble gases more [Kester, 1975], one might expect a lower HCFC-22 saturation anomaly than CFC-11.
Although differences in physical properties can be used to explain the CFC-11 and CFC-12 anomalies observed on this cruise, this reasoning for physical control of the difference between HCFC-22 and CFC-11 is not obvious in our data set. Warming and cooling was minimal in the tropical areas at this time (Table 4) and cannot quantitatively explain the observed departures. Also, there is some latitudinal dependence of the HCFC-22 net saturation anomaly, which implies a possible temperature-dependent effect. By contrast, the net anomaly for CFC-12 is reasonably constant.
Our conclusion, then, is that although physical processes may be contributing in part to the observed undersaturations of HCFC-22, it is very likely that some in situ process is removing HCFC-22 in tropical and subtropical surface waters. This process may involve hydrolysis, some other chemicals reaction, or even microbial metabolism. The removal rate could be as much as 10 times the published hydrolysis rates, but those rates must be considered only tentative at this time. Subsurface removal, as was observed for CCl4, is unlikely for HCFC-22, as the deep-water profiles did not differ significantly from those for the conservative halocarbons, CFC-11 and CFC-12. However, the uncertainty of HCFC-22 data at depth still leaves this question somewhat open. The removal rate, whatever its cause, corresponds to a partial atmospheric lifetime of 700 y, accounting for 2% of all atmospheric losses.
The estimate of the HCFC-22 lifetime of 13.6 (+1.9, -1.5) years reported by Montzka et al. [1993] is based on emission estimates and mixing ratio measurements, hence, reflects the global lifetime. Calculations based on 3-D models and OH reaction rates suggest a lifetime for the removal of HCFC-22 by OH of 12-14 years, after being corrected for recent adjustments to the OH reaction rate [Prather and Spivakowsky, 1990; Golombek and Prinn, 1989; Talukdar et al., 1992]. Our findings would require that the atmospheric lifetime be adjusted upward by 2%, but have no effect upon the global lifetime. However, at this point the differences are insignificant, and even under the assumption of a 50% uncertainty in the oceanic lifetime estimate, the resulting contribution of the oceanic removal would still be within the uncertainty of current lifetime estimates.
Oceanic consumption of CH3CCl3 in tropical waters was first reported by Butler et al. [1991]. Using data from two cruises, one of which involved six crossings of the equator across a range of 75° longitude in the Pacific Ocean, the authors concluded that 5-10% of atmospheric CH3CCl3 was destroyed in the surface waters. Although a loss rate of 6% would be expected from published hydrolysis rates for CH3CCl3, the SST range for those data sets was not sufficient to detect a temperature dependence for the calculated consumption rate. One of the objectives of this cruise was to measure the CH3CCl3 saturation anomaly over a wider range of latitudes, and hence SSTs, to detect any temperature dependence of CH3CCl3 loss rates and to see if other processes might be involved as well.
Our results show a latitudinal dependence upon the saturation anomaly for CH3CCl3, but, no obvious temperature dependence of the calculated flux. The temperature/flux-relationship in our data was confounded by an unexplainable positive net saturation anomaly between 30°N and 40°N, and a negative net anomaly in the higher latitudes. Although these variations are not outside the realm of physical effects, they represent fairly strong fluxes because of the higher wind speeds and higher gas solubilities in the temperate and subarctic latitudes. In these areas, the net saturation anomalies for CFC-11 and CH3CCl3 were both positive, with CFC-11 somewhat higher. This is explainable by injection of air bubbles, which preferentially supersaturate less soluble gases, and would yield a negative net anomaly for CH3CCl3. The observed anomalies at higher latitudes may have resulted from this, in which case the calculated fluxes are not net fluxes, but merely temporal exchanges between the ocean and atmosphere. However, we cannot completely rule out the possibility of some biological sink at the higher latitudes. Despite the larger negative fluxes (Figure 18b), this would not be as great a global contribution as the sink in the tropics, because the coverage of the ocean at latitudes between 40° and 70° (north and south combined) is only 43% of the area between 40°N and 40°S. A strong subsurface sink for CH3CCl3 is unlikely, as the deepwater profiles strongly resemble those for CFC-11, indicating that CH3CCl3 is conserved in the cooler waters below the surface layer (Figures 14, 15).
Although data from this cruise qualitatively support the Butler et al. [1991] findings of an oceanic sink for atmospheric CH3CCl3, the corresponding saturation anomalies and calculated fluxes are much smaller in this data set. Butler et al. [1991] reported a mean net saturation anomaly of -11% for two separate cruises and calculated a mean tropical flux of 3.1 nmol m-2 d-1. In contrast, the mean net saturation anomaly for CH3CCl3 in the tropics (20°N-22°S) during this cruise was 4.3%, representing a flux of 1 nmol m-2 d-1. However, during the final leg of the second cruise of the Butler et al. [1991] study, which covered only the West Pacific (crossing our cruise track), the mean net saturation anomaly for CH3CCl3 was only -6.1%, with a calculated flux for the West Pacific of 1.5 nmol m-2 d-1. We consider these latter values to be in general agreement with the results from this cruise, and indicative of the temporal and spatial variability of gas saturations. Such variability would be driven by short-and long-term differences in wind speeds, mixed layer depth, white-cap coverage, and upwelling intensity. Although the results for this cruise differ to some extent from the overall results of Butler et al. [1991], the regional differences are small and the two studies are not in conflict. Moreover, the different results are evidence of significant longtitudinal and temporal variations in gas saturations and fluxes.
CCl4 apparently is consumed in significant quantities throughout the oceans. This is supported by data we have collected on research expeditions in 1987 (tropical Pacific), 1989 (East Pacific, wide range of latitudes), and 1990 (tropical Pacific) [Butler et al., 1993]. The strong, negative saturation anomalies for CCl4 are not explainable by simple physical processes, and the flux appears to be somewhat temperature-dependent in the tropics. However, unlike CH3CCl3, CCl4 is not believed to hydrolyze rapidly. Until recently, hydrolysis was thought to be second-order in CCl4, leading to a mean lifetime on the order of 10,000 y [Fells and Moelwyn-Hughes, 1959]. Jeffers et al. [1989a] and Jeffers et al. [1989] showed that the hydrolysis of CCl4 exhibits first-order behavior with a strong temperature dependence, and that CCl4 is much more rapidly hydrolyzed than previously believed. Although the mean lifetime of CCl4 in pure 0°C water is still on the order of 5000 years, it is shortened to around 60 y at 25°C. (In seawater, the solubility of CCl4 drops about 20%, but its hydrolysis rate would be expected to increase by 10-20%. Unless there is some specific ion effect, we can expect a similar hydrolysis lifetime for CCl4 in seawater.) Nevertheless, this highest expected rate of hydrolysis corresponds to a pseudo-first-order rate constant of 5.310-10, which could only give rise to a net saturation anomaly of -0.1%. However, at this time CCl4 hydrolysis rates in seawater must remain in question.
Consumption of CCl4 by other reactions or by organisms in the surface ocean is a possible explanation for the observed negative anomaly. Carbon tetrachloride is reduced by certain transition metal complexes, and has been demonstrated to be consumed microbially in absence of dissolved oxygen [Vogel et al., 1987]. CCl4 has a short pseudo-first-order reduction rate for radical formation [Klecka and Gonsior, 1984] and a relatively low heat of radical formation, which would tend to make it somewhat more reactive than other halogenated aliphatic compounds. Although the surface ocean is well oxygenated, as is most of the deep ocean as well, organisms are capable of maintaining reducing conditions either intracellularly or among clusters of cells or detritus. This task is made easier where the total dissolved oxygen is low, such as the O2 minimum between 400-800 m in most of the ocean. A number of deep-water profiles clearly show the in situ consumption of CCl4 at intermediate depths near the oxygen minimum, although this was not ubiquitous; CCl4 appeared conservative in many profiles. Wallace et al. [1993], however, have also observed this phenomenon throughout the Atlantic, indicating that the subsurface deficit of CCl4 is widespread.
To maintain the observed CCl4 net saturation anomalies, a flux of 0.3-1.1 nmol m-2 d1 is required. It is possible to make a crude estimate of the downward transport of CCl4 needed to maintain a steady-state deficit in intermediate waters. The calculation proceeds as follows:
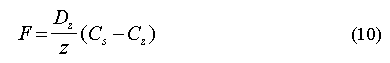
where F is the downward flux of CCl4 (mol m-2 d-1), Dz is the vertical eddy-diffusion coefficient through the thermocline (14.7 m-2 d-1), z is the depth range of transport, and Cs and Cz are the CFC-11 corrected concentrations of CCl4 at the surface and at the center of the CCl4 deficit. For both stations, these calculations yield a flux of about 0.1-0.2 nmol m-2 d-1. Given the assumptions necessary for such a simplified calculation, fluxes of this order may be sufficient to support the observed saturation anomalies. However, we cannot rule out other possible sinks at this time.
The flux of CCl4 from the atmosphere required to sustain
the observed saturation anomalies under steady state conditions
represents a partial atmospheric lifetime of around 250 y for
loss to the ocean. The best estimate of the global CCl4
atmospheric lifetime is 40 years, meaning that 16% of the atmospheric
CCl4 is lost to the ocean. This number is at the lower
end of the range of values calculated from our other cruises (15-35%),
but still within an expected range of variability. The loss of
CCl4 to the ocean is a significant sink, as it means
substantially less chlorine will be delivered to the stratosphere.

AFEAS (Alternative Fluorocarbon Environmental Acceptability Study), Chlorofluorocarbons (CFCs) 11 and 12. Report prepared for AFEAS by Grant Thornton, Washington, DC (1991).
Butler, J. H., and J. W. Elkins., An automated technique for the measurement of dissolved N2O in natural waters. Marine Chemistry 34, 47-61 (1988a).
Butler, J.H., J.W. Elkins, C.M. Brunson, K.B. Egan, T.M. Thompson, T.J. Conway, and B.D. Hall. Trace Gases in and Over the West Pacific and the East Indian Oceans During the El Niño Southern Oscillation Event of 1987. NOAA Data Report ERL ARL-16 (1988b). Available from NTIS, 5285 Port Royal Road, Springfield, VA 22161 USA.
Butler, J. H., J. W. Elkins, T. M. Thompson and K. B. Egan, Tropospheric and dissolved N2O of the West Pacific and East Indian Oceans During the El Niño-Southern Oscillation Event of 1987. J. Geophys. Res. 94, 14865-14877 (1989).
Butler, J.H., J.W. Elkins, T.M. Thompson, and B.D. Hall. Oceanic Consumption of CH3CCl3: Implications for Tropospheric OH. J. Geophys. Res. 96D, 22347-22355 (1991)
Butler, J.H., J.W. Elkins, T.M. Thompson, B.D. Hall, J.M. Lobert, and T.S. Swanson., A significant oceanic sink for atmospheric CCl4. In: Abstracts of the Third Scientific Meeting of the Oceanography Society, Seattle, April 13-16, p55, The Oceanography Society, Washington DC, (1993).
Bullister, J.L, and R.F. Weiss. Determination of CCl3F and CCl2F2 in seawater and air. Deep Sea Research 35, 839-853 (1988).
Bullister, J.L., D. Wisegarver, and F. Menzia et al. NOAA Pacific Marine Environmental Laboratory, 7600 Sand Point Way NE, Seattle, WA, 98115, unpublished results (1992).
Downing, R.C., Fluorocarbons Refrigerants Handbook. Prentice Hall, Englewood Cliffs, NJ, 402 (1988).
Elkins, J.W., T.M. Thompson, T.H. Swanson, J.H. Butler, B.D. Hall, S.O. Cummings, D.A. Fisher, and A.G. Raffo. A Slowdown in the Atmospheric Growth Rates of CFC-11 and CFC-12. Nature 364, 780-783 (1993).
Elkins et al. Airborne gas Chromatograph for in Situ Measurements of Long-Lived Species in the Upper Troposphere and Lower Stratosphere. Geophys. Res. Lett. , in press (1996).
Fells, I., and E. A. Moelwyn-Hughes. The kinetics of the hydrolysis of chlorinated methanes. J. Chem. Soc., 398 (1959).
Gossett, J.M. Measurement of Henry's Law constant for C1 and C2 Chlorinated Hydrocarbons. Environ. Sci. Technol. 21, 202-208 (1987).
Grimsrud, E.P., and D.A. Miller. Oxygen Doping of Carrier Gas in Measurement of Halogenated Methanes by Gas Chromatography with Electron Capture Detection. Anal. Chem. 50, 1141 (1978).
Hayduk, W., and H. Laudie. Prediction of diffusion coefficients for non-electrolytes in dilute aequous solutions. J. Am. Inst. Chem. Eng. 20, 611-615 (1974).
Jeffers, P.M., L.M. Ward, L.M. Woytowitch, and N.L. Wolfe. Homogenous hydrolysis rate constants for selected chlorinated methanes, ethanes, ethenes, and propanes. Environ. Sci. Technol. 23, 965-969 (1989a).
Jeffers, P.M., N.L. Wolfe, D.W.R. Wallace, and M. Krysell. Hydrolysis of carbon tetrachloride. Science 246, 1638-1639 (1989b).
Johnson, J.E. The lifetime of carbonyl sulfide in the troposphere. Geophys. Res. Lett. 8, 938-940 (1981).
Kester, D.R. Dissolved gases other than CO2. In: Chemical Oceanography 1, J.P. Riley and G. Skirrow (eds), Academic Press, New York, 497-556 (1975).
Klecka, G.M., and S.J. Gonsior. Reductive dechlorination of chlorinated methanes and ethanes by reduced iron (II) porphyrines. Chemosphere 13, 391-402, (1984).
Krysell, M., and D.W.R. Wallace. Arctic Ocean ventilation studied with a suite of anthropogenic halocarbon tracers. Science 242, 746-749 (1988).
Law, C. S. and N. J. P. Owens, Significant flux of atmospheric nitrous oxide from the northwest Indian Ocean. Nature 346, 826-828 (1990).
Li, Y.H., T.H. Peng, W.S. Broecker, and H.G. Ostlund. The average vertical mixing coefficient for the oceanic thermocline. Tellus 36B, 212-217 (1984).
McLinden, M.O. Physical properties of alternatives to the fully halogenated chlorofluorocarbons, in: Scientific Assessment of Stratospheric Ozone: 1989. Vol II. In: AFEAS Report. WMO Global Ozone Project Report No. 20, II, 469pp, AFEAS, (1989).
Montzka, S.A., R.C. Myers, J.H. Butler, J.W. Elkins, and S.O. Cummings. Global Tropospheric Distribution and Calibration Scale of HCFC-22. Geophys. Res. Lett. 20, 703-706 (1993).
Murphy, P.P., C.Cosca, D.C. Lee, and R.A. Feely. Temperature Calibration and Correction Report for PMEL Trace Gas Cruises 1986-1989. NOAA Technical Memorandum ERL PMEL-97 (1993). Available from NTIS, 5285 Port Royal Road, Springfield, VA 22161 USA.
Prinn, R.G., D. Cunnold, R. Rasmussen, P. Simmonds, F. Alyea, A.J. Crawford, P. Fraser, and R. Rosen. Atmospheric trends in methylchloroform during 1978-1985 and the global average OH concentration. Science 238, 945-950 (1987).
Prinn R.D., Cunnold, P. Simmonds, F. Alyea, R. Boldi, A. Crawford, P. Fraser, D. Gutzler, D. Hartley, R. Rosen, and R. Rasmussen. Global average concentration and trend for hydroxyl radicals deduced from ALE/GAGE trichloroethane (methyl chloroform) data for 1978-1990. J. Geophys. Res. 97D, 2445-2461 (1992)
Simmonds, P.G., D.M. Cunnold, F.N. Alyea, C.A. Cardelino, A.J. Crawford, R.G. Prinn, P.J. Fraser, R.A. Rasmussen, and R. Rosen. Carbon tetrachloride lifetimes and emissions determined from daily global measurements during 1978-1985. J. Atmos. Chem. 7, 35-58 (1988).
Talukdar, R.K., A. Mellouki, A. Schmoltner, T. Watson, S.A. Montzka, and A.R. Ravishankara. Kinetics of the OH reaction with methyl chloroform and its atmospheric implications. Science 257, 227-230 (1992).
Thompson T.M. (ed), J.W. Elkins, J.H. Butler, S.A. Montzka, R.C. Myers, T.J. Baring, S.O. Cummings, G.S. Dutton, J.M. Gilligan, A.H. Hayden, J.M. Lobert, T.H. Swanson, D.F. Hurst, and C.M. Volk. In: CMDL No. 22 Summary Report 1993. J.T. Peterson and R.M. Rosson (eds), chapter 5, 72-91 (1994). Available from the authors or from NTIS, 5285 Port Royal Road, Springfield, VA 22161 USA.
Thompson, T.L. NOAA Aeronomy Laboratory, 325 Broadway R/E/AL6, Boulder, CO 80303, unpublished (1991).
UNEP (United Nations Environmental Program), Montreal protocol to reduce substances that deplete the ozone layer report, Final Report. UNEP, New York (1987).
Vogel, T. M., C. S. Criddle, and P. L. McCarty. Transformations of halogenated aliphatic compounds. Environ. Sci. Technol. 21, 722-736, (1987).
Wallace, D.W.R. and C.D. Wirick. Large air-sea gas fluxes associated with breaking waves. Nature 356, 694-696 (1992).
Wallace, D. W. R., P. Beinung, and A. Putzka. Carbon Tetrachloride and Chlorofluorocarbons in the South Atlantic Ocean 19°S. J. Geophys. Res. 99C, 7803-7819 (1993).
Wanninkhof R..Relationship Between Wind Speed and gas Exchange Over the Ocean. J. Geophys. Res. 97C, 7373-7382 (1992).
Warner, M.J., and R.F. Weiss. Solubilities of chlorofluorocarbons 11 and 12 in water and seawater. Deep-Sea Research 32, 1485-1497 (1985).
Weast, R.C. (ed) Handbook of Chemistry and Physics. CRC Press 60, (1979/80).
Weiss, R.F., Nitrous oxide in the surface water and marine atmosphere of the North Atlantic and Indian Oceans. EOS, Transactions of the American Geophysical Union 59, 1101 (1978).
Weiss, R.F. and B.A. Price. Nitrous Oxide Solubility in Water and Seawater. Marine Chemistry, 8, 347-359 (1980).
Weiss, R.F., Surface water and atmospheric trace gas measurements during the NORPAX Hawaii-Tahiti shuttle experiment. EOS, Transactions of the American Geophysical Union 62, 894 (1981).
Wine, P.H., and W.L. Chameides. Possible atmospheric lifetimes and chemical reaction mechanisms for selected HCFC's, HFC's, CH3CCl3, and their degradataion products against dissolution and / or degradation in seawater and cloudwater. In: Scientific Assessment of Stratospheric Ozone: 1989 2, World Meteorological Organization, Geneva 272-295, (1989).
WMO
Scientific Assessment of Ozone Depletion: 1994. United Nations
Envrionment Programme (UNEP), Ozone Secretariat, PO Box 30552,
Nairobi, Kenya (1995).

Data from this report and other published data from the Nitrous Oxide and Halocompounds division are available through a public account on our HP 380 UNIX server. To download these data, use
your FTP (file transfer protocol) communications utility. Connect to FTP.CMDL.NOAA.GOV, logon with username "anonymous" and use your email address as your
password, then select subdirectory /NOAH/OCEAN/OAXTC_92/. Alternatively, click here or on the disc image to get there via world wide web. Once logged on, please make sure to read the file "0_readme.1st" before you download data. In most cases, you do not need to download all files, but rather a few files that are specific for your needs. Set your system to binary transfer by typing binary or clicking on the "binary" checkbox or download data by clicking on the appropriate file in your browser. Please refer download- questions and problems to Thayne Thompson at tthompson@cmdl.noaa.gov or call our secretary at +1 303 497 6811.
This report was written using mostly metric and international
units recommended by the Systeme Internationale, SI.
° degree of latitude or longtitude. One degree of latitude equals 60 latitudinal minutes or 60 nautical miles (nm). 1 nm = 1.852 km. The length of one longtitudinal degree depends on the absolute latitude and can be calculated by 1° lon = 60 nm cos(° lat) = 111.1 km cos(° lat).
Pa Pascals, SI unit of pressure. 1*105 Pa = 1 bar = 1.013 atm = 14.5 PSI. One hectopascal (hPa) is equal to one millibar.
ppt parts per trillion, or 10-12 parts per part.
ppb parts per billion, or 10-9 parts per part.
AASE II Arctic Airborne Stratospheric Expedition II 1991.
ACATS Airborne Chromatograph for Atmospheric Trace Species, a miniaturized GC system developed for and used during the AASE II and the SPADE missions for the determination of CFCs 11 and 113.
CMDL Climate Monitoring and Diagnostics Laboratory, Boulder, CO.
CTD Short form for Conductivity, Temperature, and Depth, the three basic oceanographic measurements carried out during a deepwater cast.
DOY Julian Day Of Year, the decimal day of the year 1992.
ECD Electron Capture Detector.
GC Gas Chromatograph.
MLO Mauna Loa, one of the CMDL background stations.
NOAA National Oceanic and Atmospheric Administration.
NOAH Nitrous Oxide And Halocompounds Division.
NWR NiWot Ridge, one of the CMDL background stations.
OAXTC Ocean Air Exchange of Trace Compounds
PMEL Pacific Marine Environmental Laboratory, Seattle, WA.
RITS Radiatively Important Trace Species, refers to the CMDL/NOAH standard suite of the gases CFC-12, CFC-11, CFC-113, methyl chloroform (CH3CCl3), carbon tetrachloride (CCl4) and nitrous oxide (N2O).
RTD Platinum resistance temperature sensitive device, delivers 100 resistance at 0°C, increasing with temperature.
SMO American Samoa, one of the CMDL background stations.
SPADE Stratospheric Phochemistry Aerosol Dynamics Expedition 1993.
WOCE World Ocean Circulation Experiment.
Abbreviation Name IUPAC formula
HCFC-22 Hydrochlorofluorocarbon 22 CHClF2
CFC-11 Chlorofluorocarbon 11 CCl3F
CFC-12 Chlorofluorocarbon 12 CCl2F2
CFC-113 Chlorofluorocarbon 113 CCl2F-CClF2
CH3CCl3 Methyl chloroform CH3-CCl3
CCl4 Carbon tetrachloride CCl4
N2O Nitrous oxide N2O
This work was funded by the Alternative Fluorocarbon Environmental Acceptability Study (AFEAS) and the Atmospheric Chemistry Project of NOAA's Climate and Global Change Program. The authors like to thank the rest of the Nitrous Oxide and Halocompounds Division for their support and advice throughout the mission. We appreciate the work of Thayne Thompson and Thomas Swanson in providing station data for most compounds. We also are grateful to Drs. John Bullister, Dave Wisegarver, and Fred Menzia of NOAA/PMEL for making this cruise possible and for permission to use their deepwater data of CFC-11, CFC-12, methyl chloroform, and carbon tetrachloride for this report. We owe particular appreciation to the crew of the Vickers who never stopped being supportive despite all the problems aboard. Special thanks also to Joyce Harris for preparation of 10 day wind trajectories. We finally like to acknowledge the precruise advice of people at NOAA's Aeronomy Laboratory, in particular Richard Winkler and Thomas Thompson for their development of the OAXTC system's data acquisition devices.
Jürgen M. Lobert - 26-January-1996